Plot latitude/longitude vs time (UTC rounded to the hour) for each tag using motus detection data. Coordinate is by default taken from a receivers deployment latitude in metadata.
Arguments
- data
a selected table from motus data, eg. "alltags", or a data.frame of detection data including at a minimum variables for
recvDeployName,fullID,mfgID, date/time,latitudeorlongitude- coordinate
column name from which to obtain location values, by default it is set to
recvDeployLat- ts
column for a date/time object as numeric or POSIXct, defaults to
ts- tagsPerPanel
number of tags in each panel of the plot, by default this is 5
Exemples
# You can use either a selected tbl from .motus eg. "alltags", or a
# data.frame, instructions to convert a .motus file to all formats are below.
# download and access data from project 176 in sql format
# usename and password are both "motus.sample"
if (FALSE) sql.motus <- tagme(176, new = TRUE, update = TRUE)
# OR use example sql file included in `motus`
sql.motus <- tagme(176, update = FALSE,
dir = system.file("extdata", package = "motus"))
# convert sql file "sql.motus" to a tbl called "tbl.alltags"
library(dplyr)
tbl.alltags <- tbl(sql.motus, "alltags")
# convert the tbl "tbl.alltags" to a data.frame called "df.alltags"
df.alltags <- tbl.alltags %>%
collect() %>%
as.data.frame()
# Plot tbl file tbl.alltags with default GPS latitude data and 5 tags per panel
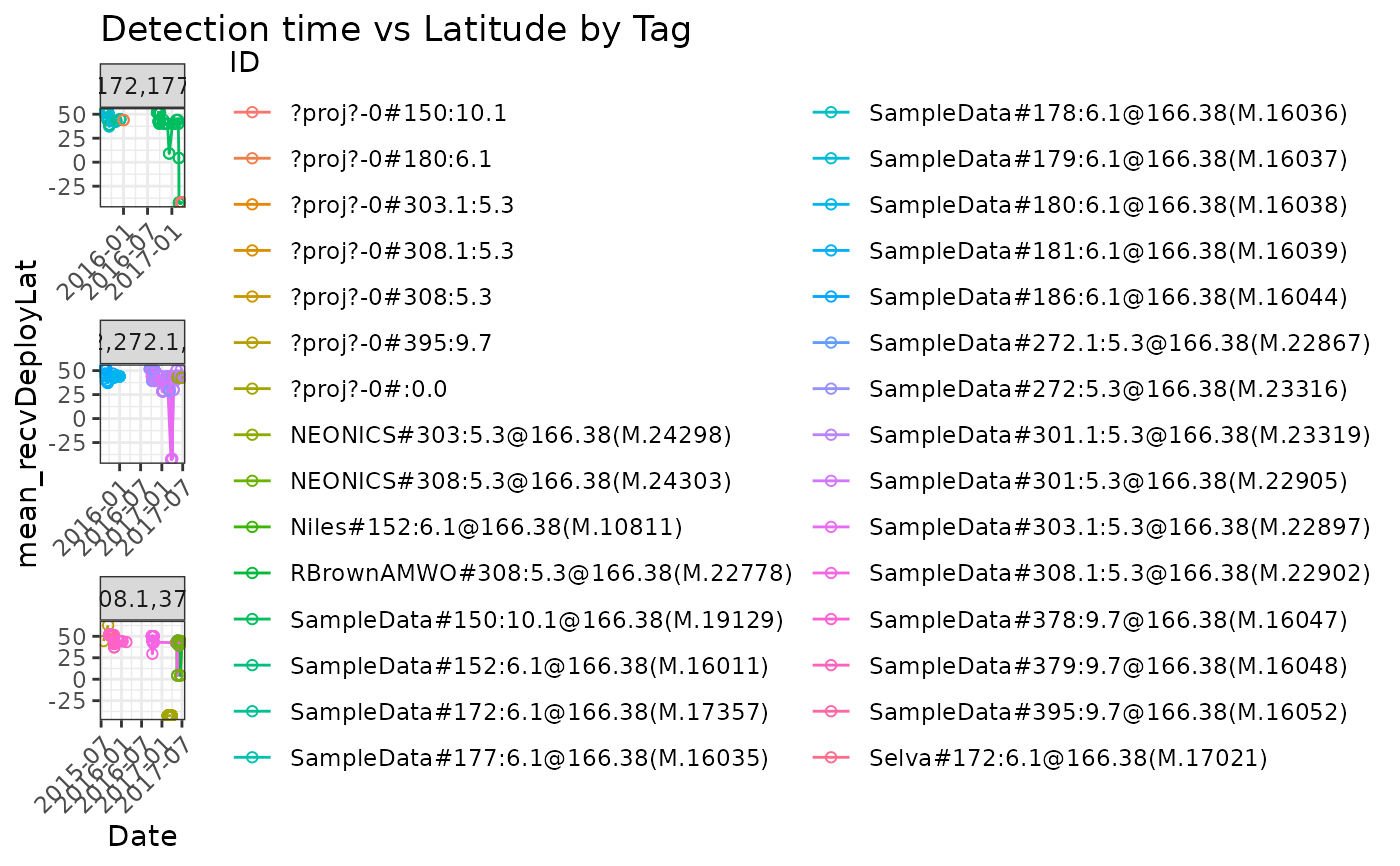
plotAllTagsCoord(tbl.alltags)
 # Plot an sql file tbl.alltags with 10 tags per panel
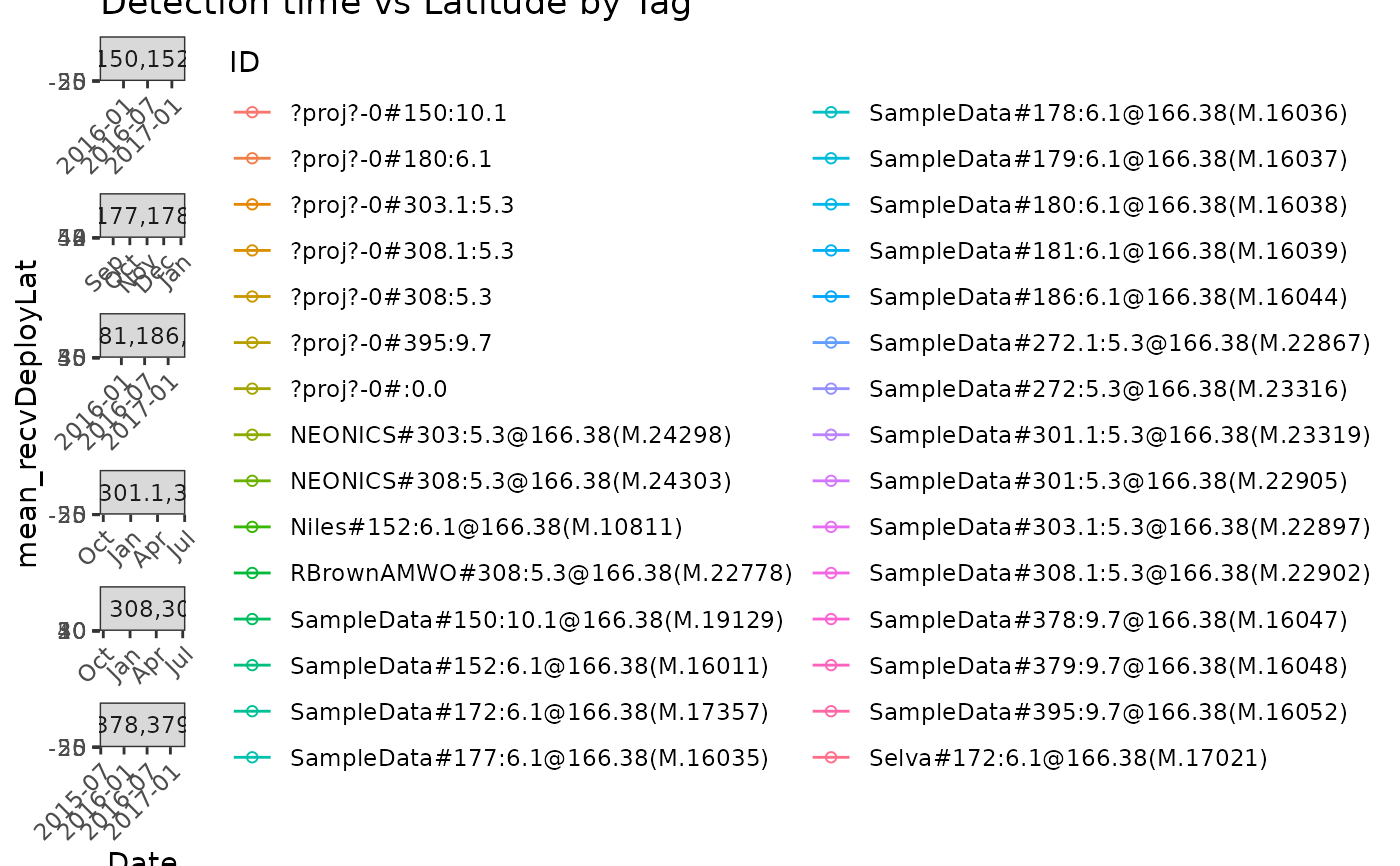
plotAllTagsCoord(tbl.alltags, tagsPerPanel = 10)
# Plot an sql file tbl.alltags with 10 tags per panel
plotAllTagsCoord(tbl.alltags, tagsPerPanel = 10)
 # Plot dataframe df.alltags using receiver deployment latitudes with default
# 5 tags per panel
plotAllTagsCoord(df.alltags, coordinate = "recvDeployLat")
# Plot dataframe df.alltags using receiver deployment latitudes with default
# 5 tags per panel
plotAllTagsCoord(df.alltags, coordinate = "recvDeployLat")
 # Plot dataframe df.alltags using LONGITUDES and 10 tags per panel
# But only works if non-NA "gpsLon"!
if (FALSE) plotAllTagsCoord(df.alltags, coordinate = "gpsLon", tagsPerPanel = 10)
# Plot dataframe df.alltags using lat for select motus tagIDs
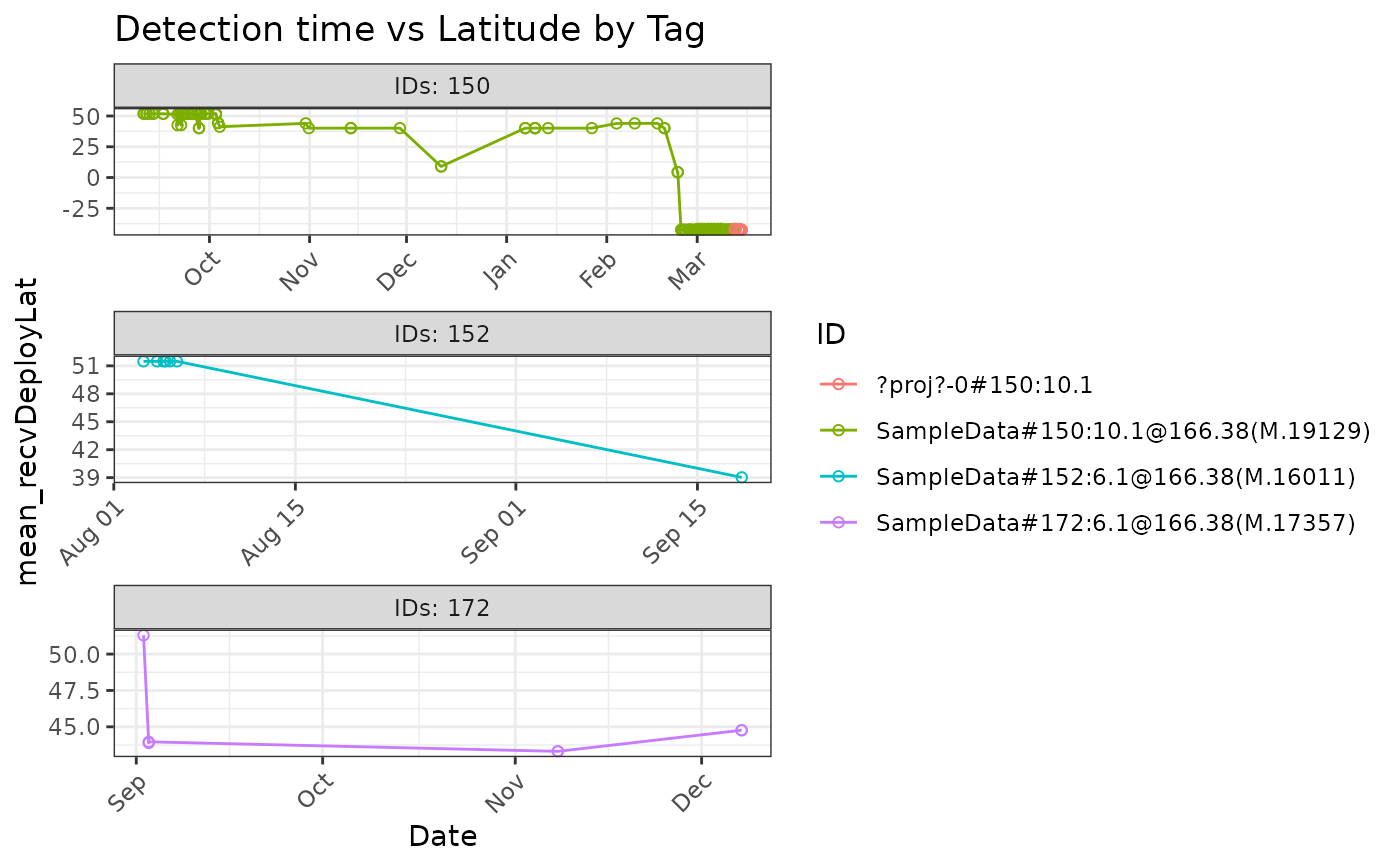
plotAllTagsCoord(filter(df.alltags, motusTagID %in% c(19129, 16011, 17357)),
tagsPerPanel = 1)
# Plot dataframe df.alltags using LONGITUDES and 10 tags per panel
# But only works if non-NA "gpsLon"!
if (FALSE) plotAllTagsCoord(df.alltags, coordinate = "gpsLon", tagsPerPanel = 10)
# Plot dataframe df.alltags using lat for select motus tagIDs
plotAllTagsCoord(filter(df.alltags, motusTagID %in% c(19129, 16011, 17357)),
tagsPerPanel = 1)