Plot deployment (ordered by latitude) vs time (UTC) for each tag
Arguments
- data
a selected table from .motus data, eg. "alltags", or a data.frame of detection data including at a minimum variables for
recvDeployName,fullID,mfgID, date/time,latitudeorlongitude- coordinate
column of receiver latitude/longitude values to use, defaults to
recvDeployLat- tagsPerPanel
number of tags in each panel of the plot, default is 5
Exemples
# You can use either a selected tbl from .motus eg. "alltags", or a
# data.frame, instructions to convert a .motus file to all formats are below.
# download and access data from project 176 in sql format
# usename and password are both "motus.sample"
if (FALSE) sql.motus <- tagme(176, new = TRUE, update = TRUE)
# OR use example sql file included in `motus`
sql.motus <- tagme(176, update = FALSE,
dir = system.file("extdata", package = "motus"))
# convert sql file "sql.motus" to a tbl called "tbl.alltags"
library(dplyr)
tbl.alltags <- tbl(sql.motus, "alltags")
# convert the tbl "tbl.alltags" to a data.frame called "df.alltags"
df.alltags <- tbl.alltags %>%
collect() %>%
as.data.frame()
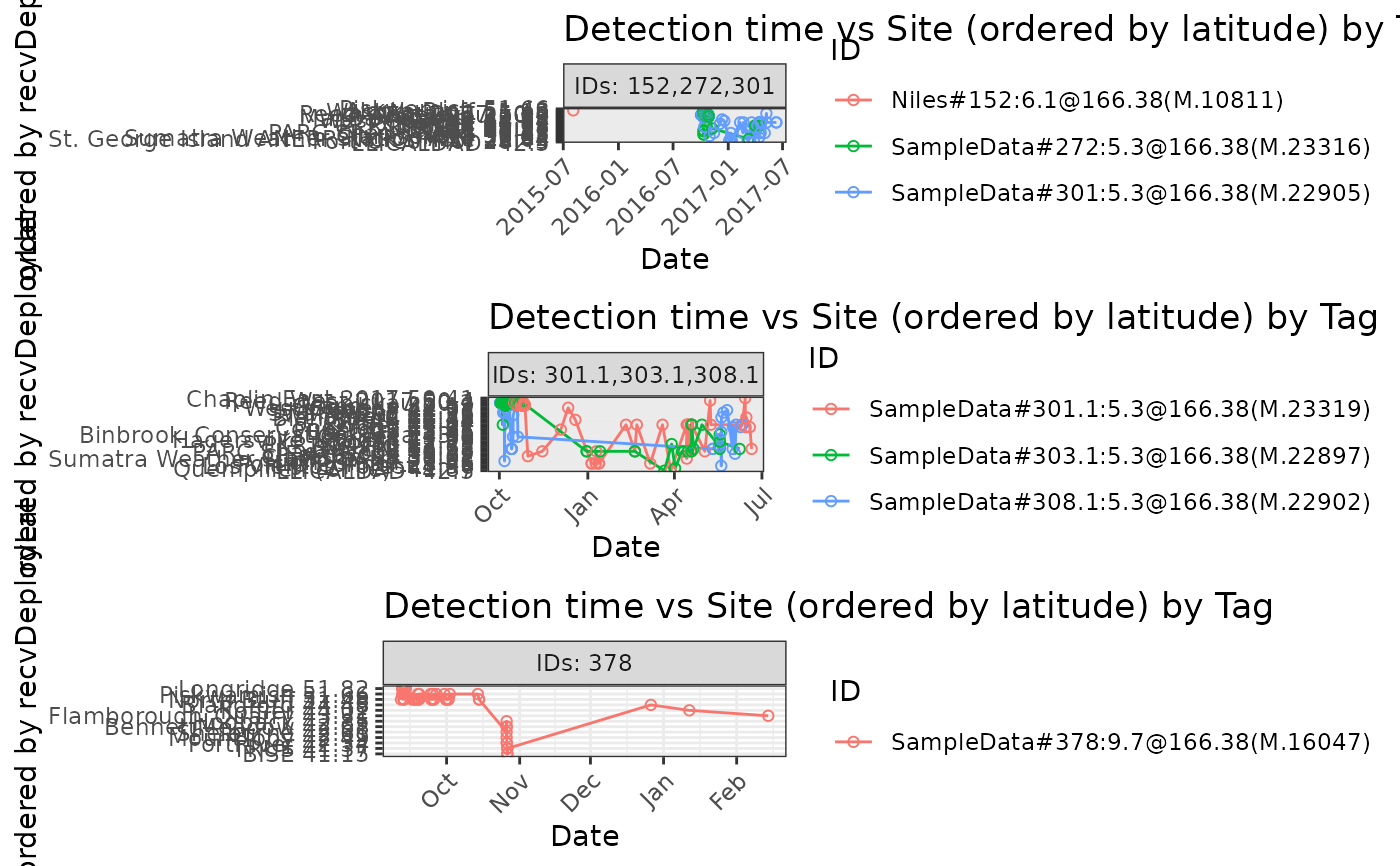
# Plot detections of dataframe df.alltags by site ordered by latitude, with
# default 5 tags per panel
plotAllTagsSite(df.alltags)
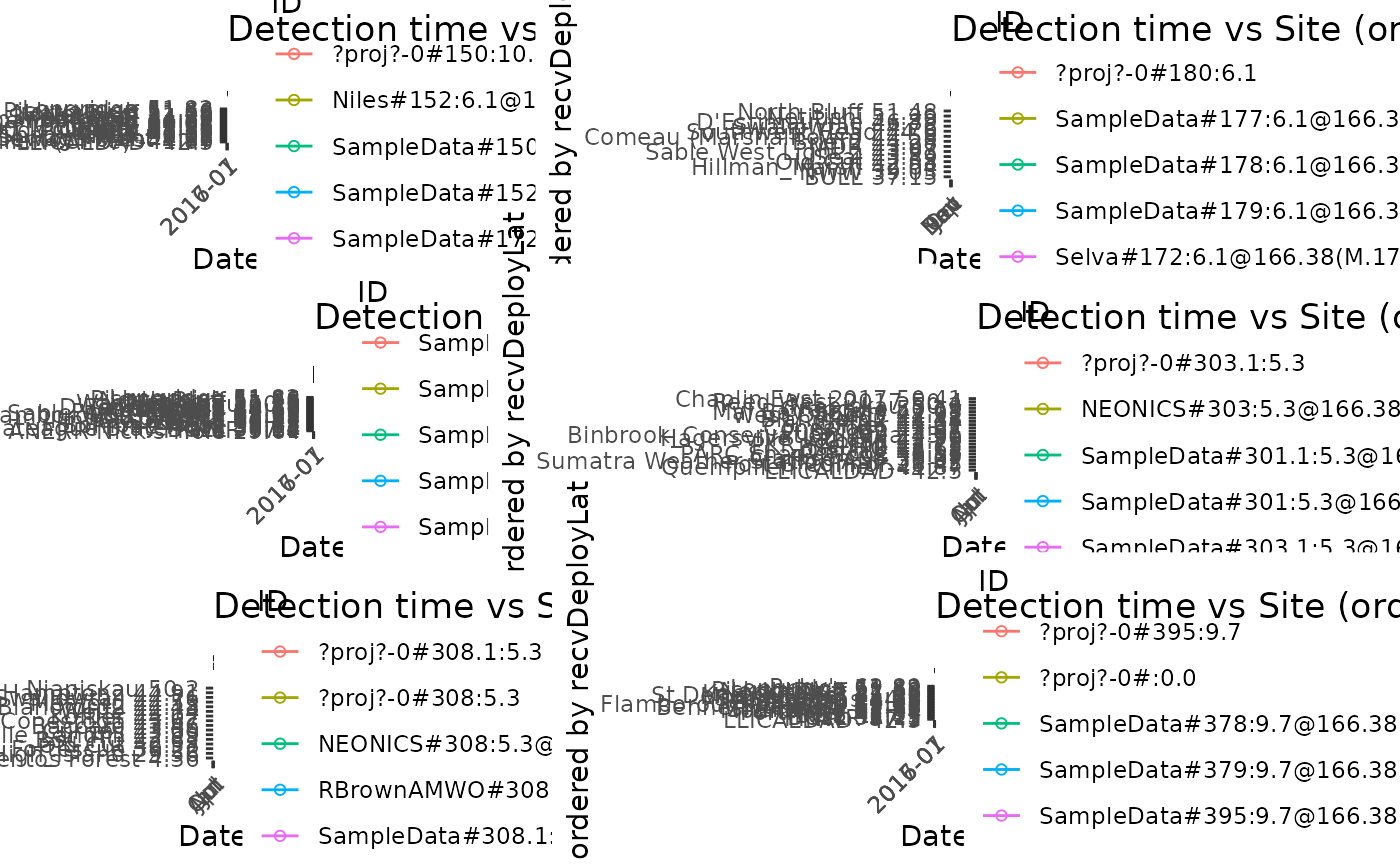 # Plot detections of dataframe df.alltags by site ordered by latitude, with
# 10 tags per panel
plotAllTagsSite(df.alltags, tagsPerPanel = 10)
# Plot detections of dataframe df.alltags by site ordered by latitude, with
# 10 tags per panel
plotAllTagsSite(df.alltags, tagsPerPanel = 10)
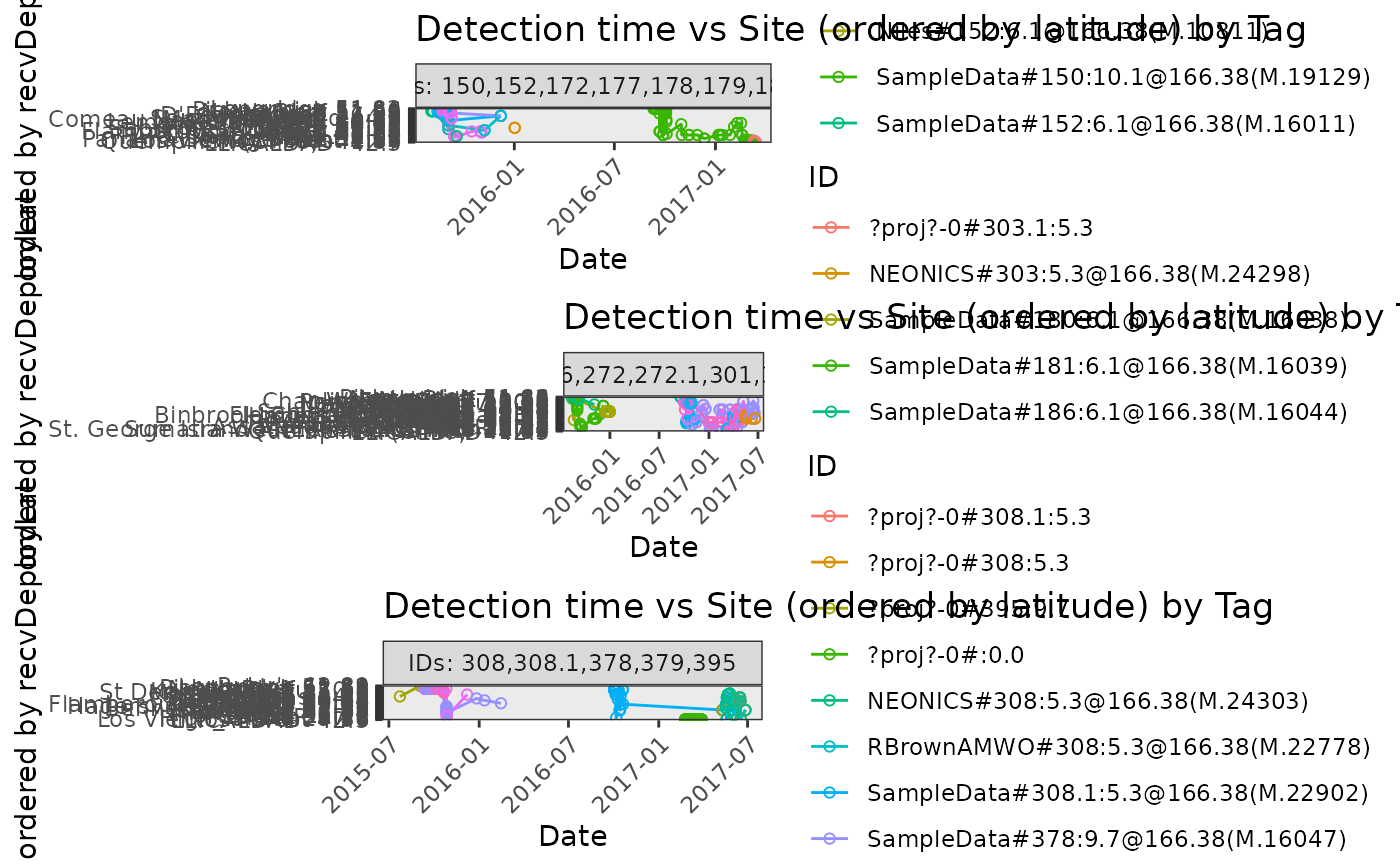 # Plot detections of tbl file tbl.alltags by site ordered by receiver
# deployment latitude
plotAllTagsSite(tbl.alltags, coordinate = "recvDeployLon")
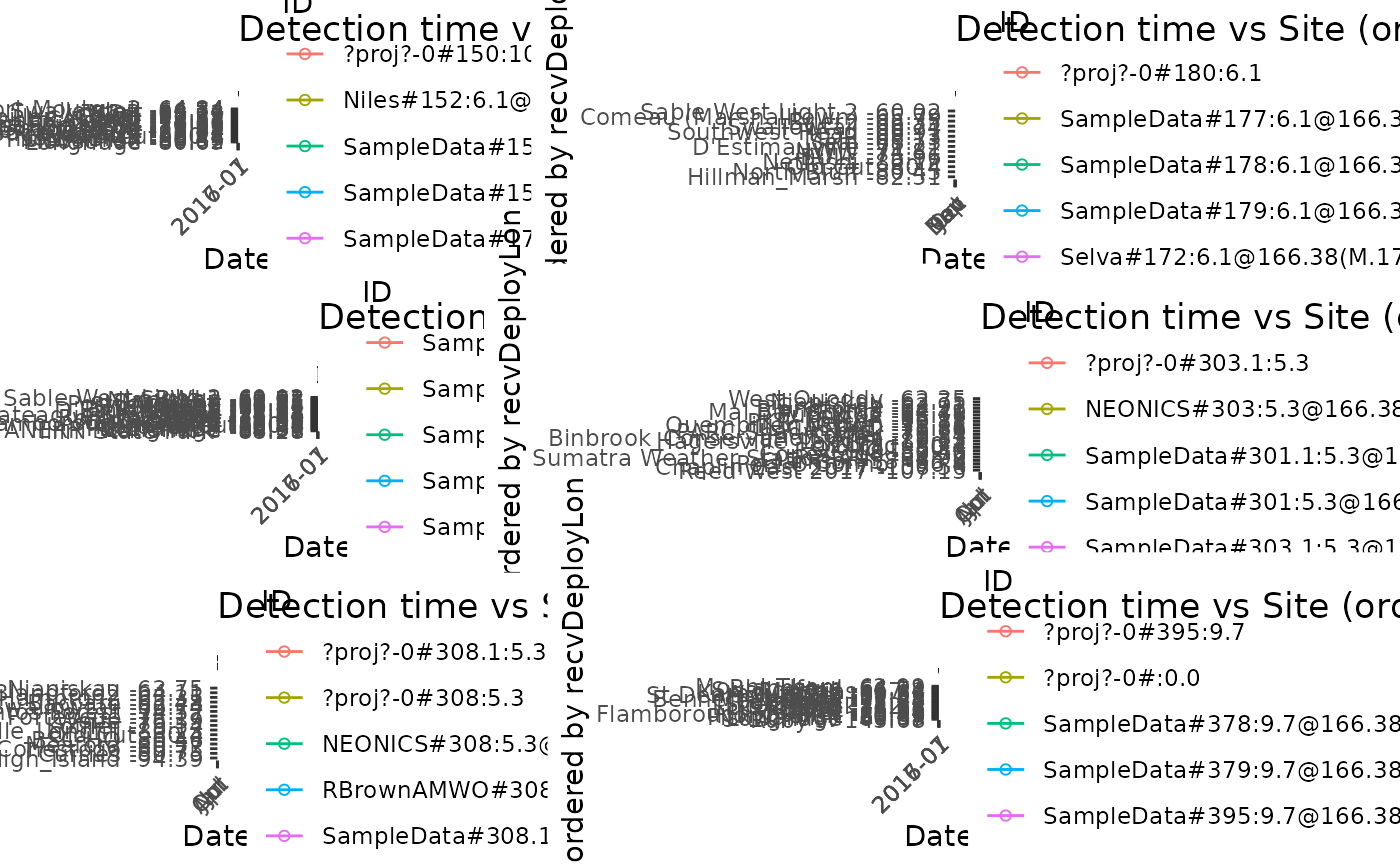
# Plot detections of tbl file tbl.alltags by site ordered by receiver
# deployment latitude
plotAllTagsSite(tbl.alltags, coordinate = "recvDeployLon")
 # Plot tbl file tbl.alltags using 3 tags per panel for species Red Knot
plotAllTagsSite(filter(tbl.alltags, speciesEN == "Red Knot"), tagsPerPanel = 3)
# Plot tbl file tbl.alltags using 3 tags per panel for species Red Knot
plotAllTagsSite(filter(tbl.alltags, speciesEN == "Red Knot"), tagsPerPanel = 3)