Plot tag ID vs time for all tags detected by site, coloured by antenna bearing
Utilisation
plotSite(data, sitename = unique(data$recvDeployName))Arguments
- data
a selected table from .motus data, eg. "alltagsGPS", or a data.frame of detection data including at a minimum variables for ts, antBearing, fullID, recvDeployName
- sitename
Character vector. Which sites to plot? Defaults to all unique sites.
Exemples
# You can use either a selected tbl from .motus eg. "alltagsGPS", or a
# data.frame, instructions to convert a .motus file to all formats are below.
# download and access data from project 176 in sql format
# usename and password are both "motus.sample"
if (FALSE) sql.motus <- tagme(176, new = TRUE, update = TRUE)
# OR use example sql file included in `motus`
sql.motus <- tagme(176, update = FALSE,
dir = system.file("extdata", package = "motus"))
# convert sql file "sql.motus" to a tbl called "tbl.alltags"
library(dplyr)
tbl.alltags <- tbl(sql.motus, "alltagsGPS")
# convert the tbl "tbl.alltags" to a data.frame called "df.alltags"
df.alltags <- tbl.alltags %>%
collect() %>%
as.data.frame()
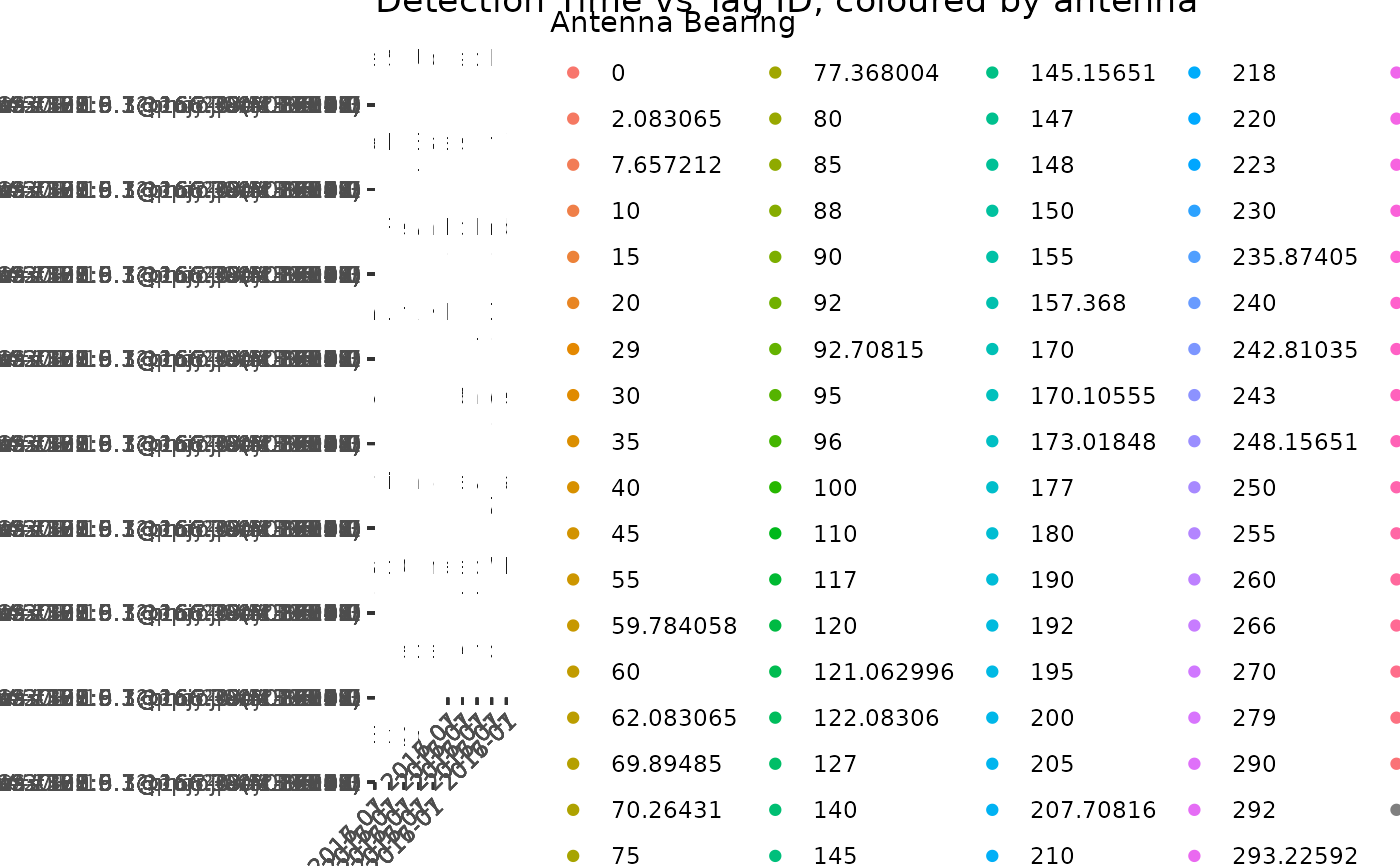
# Plot all sites within file for tbl file tbl.alltags
plotSite(tbl.alltags)
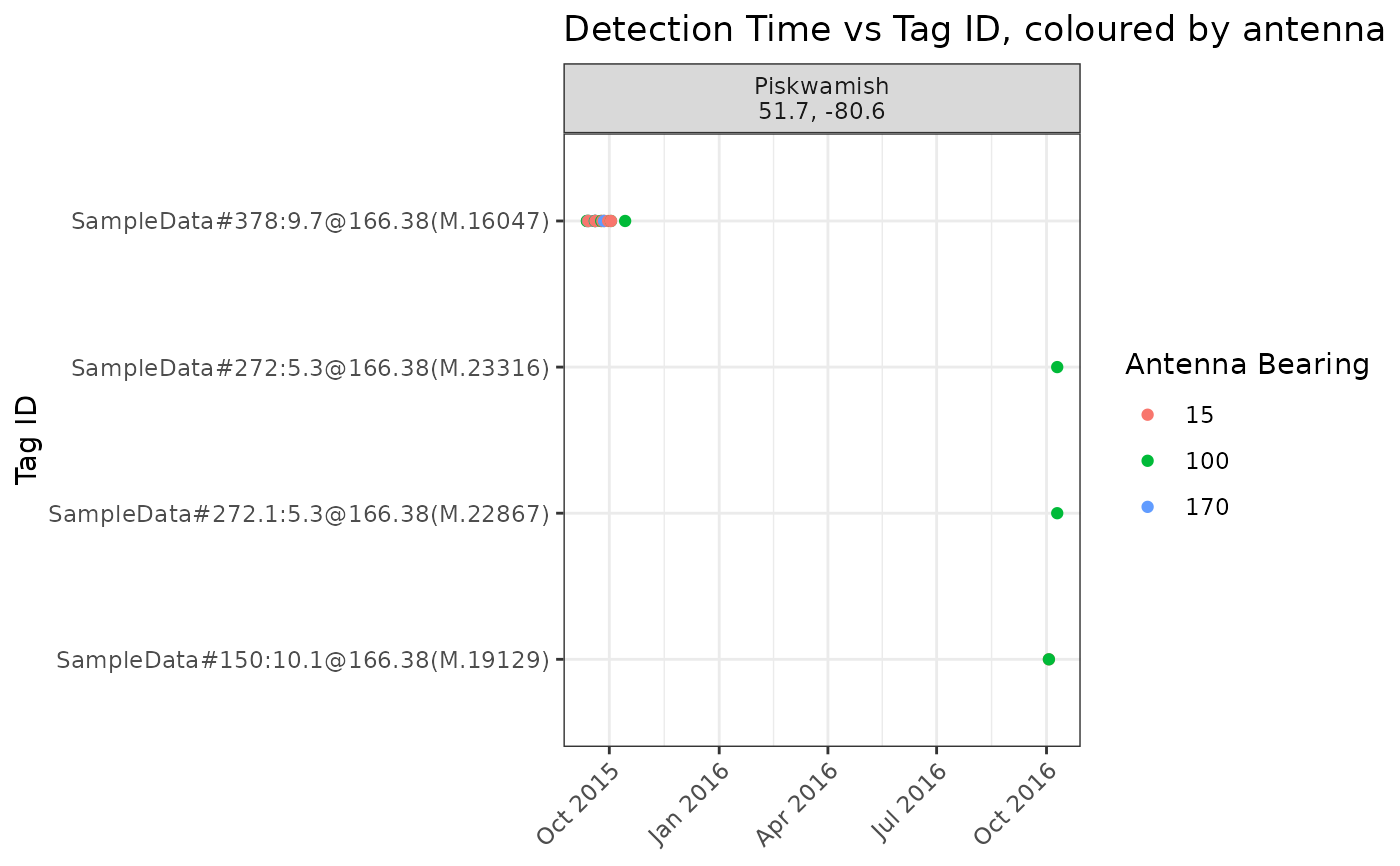
 # Plot only detections at a specific site; Piskwamish for data.frame
# df.alltags
plotSite(filter(df.alltags, recvDeployName == "Piskwamish"))
# Plot only detections at a specific site; Piskwamish for data.frame
# df.alltags
plotSite(filter(df.alltags, recvDeployName == "Piskwamish"))
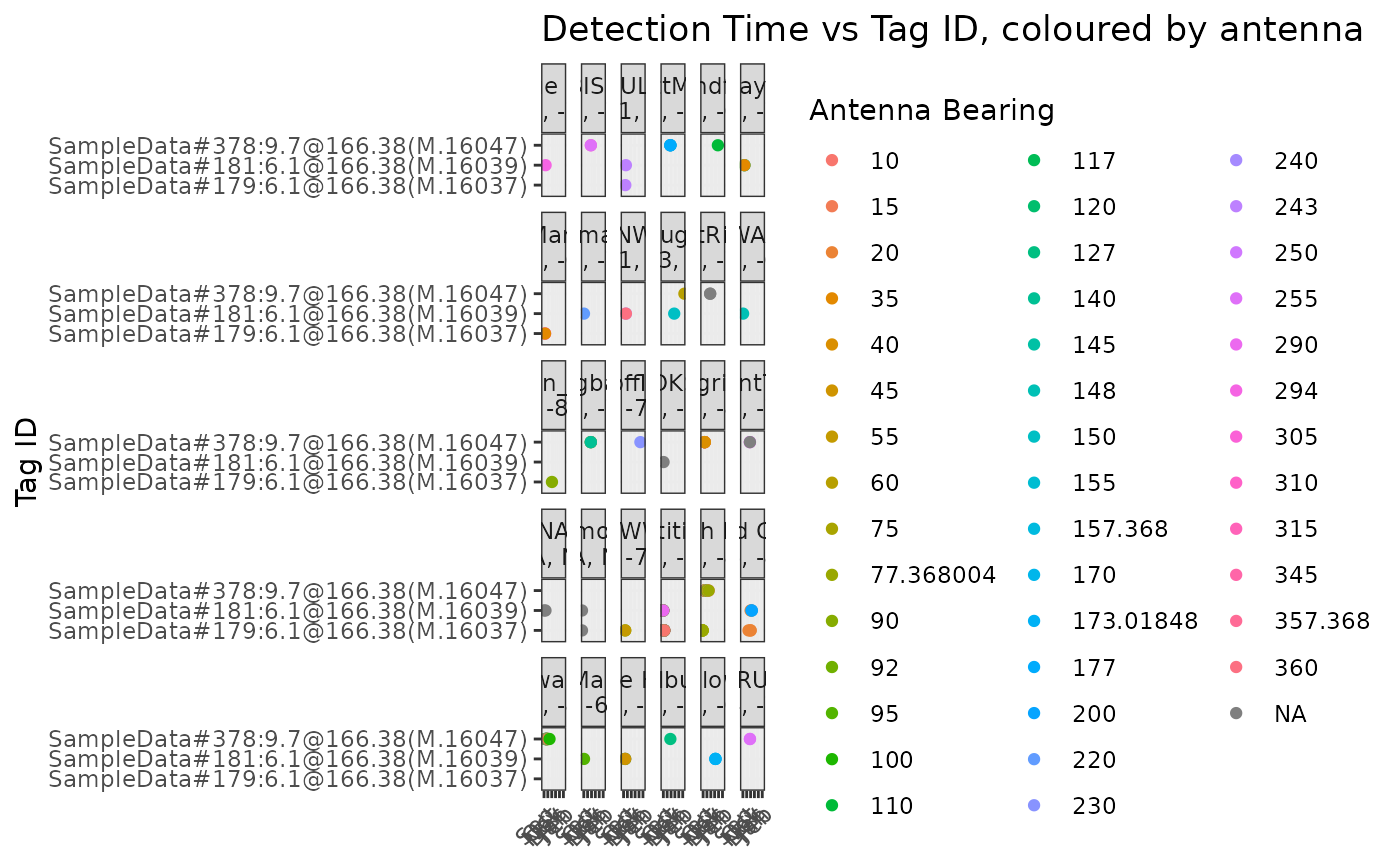
 #Plot only detections for specified tags for data.frame df.alltags
plotSite(filter(df.alltags, motusTagID %in% c(16047, 16037, 16039)))
#Plot only detections for specified tags for data.frame df.alltags
plotSite(filter(df.alltags, motusTagID %in% c(16047, 16037, 16039)))