Plot latitude/longitude vs time (UTC rounded to the hour) for each tag using motus detection data. Coordinate is by default taken from a receivers deployment latitude in metadata.
Arguments
- data
a selected table from motus data, eg. "alltags", or a data.frame of detection data including at a minimum variables for
recvDeployName,fullID,mfgID, date/time,latitudeorlongitude- coordinate
column name from which to obtain location values, by default it is set to
recvDeployLat- ts
Character. Name of column with timestamp values, defaults to
ts.number of tags in each panel of the plot, by default this is 5
Examples
# Download sample project 176 to .motus database (username/password are "motus.sample")
if (FALSE) sql_motus <- tagme(176, new = TRUE) # \dontrun{}
# Or use example data base in memory
sql_motus <- tagmeSample()
# convert sql file "sql_motus" to a tbl called "tbl_alltags"
library(dplyr)
tbl_alltags <- tbl(sql_motus, "alltags")
# convert the tbl "tbl_alltags" to a data.frame called "df_alltags"
df_alltags <- tbl_alltags %>%
collect() %>%
as.data.frame()
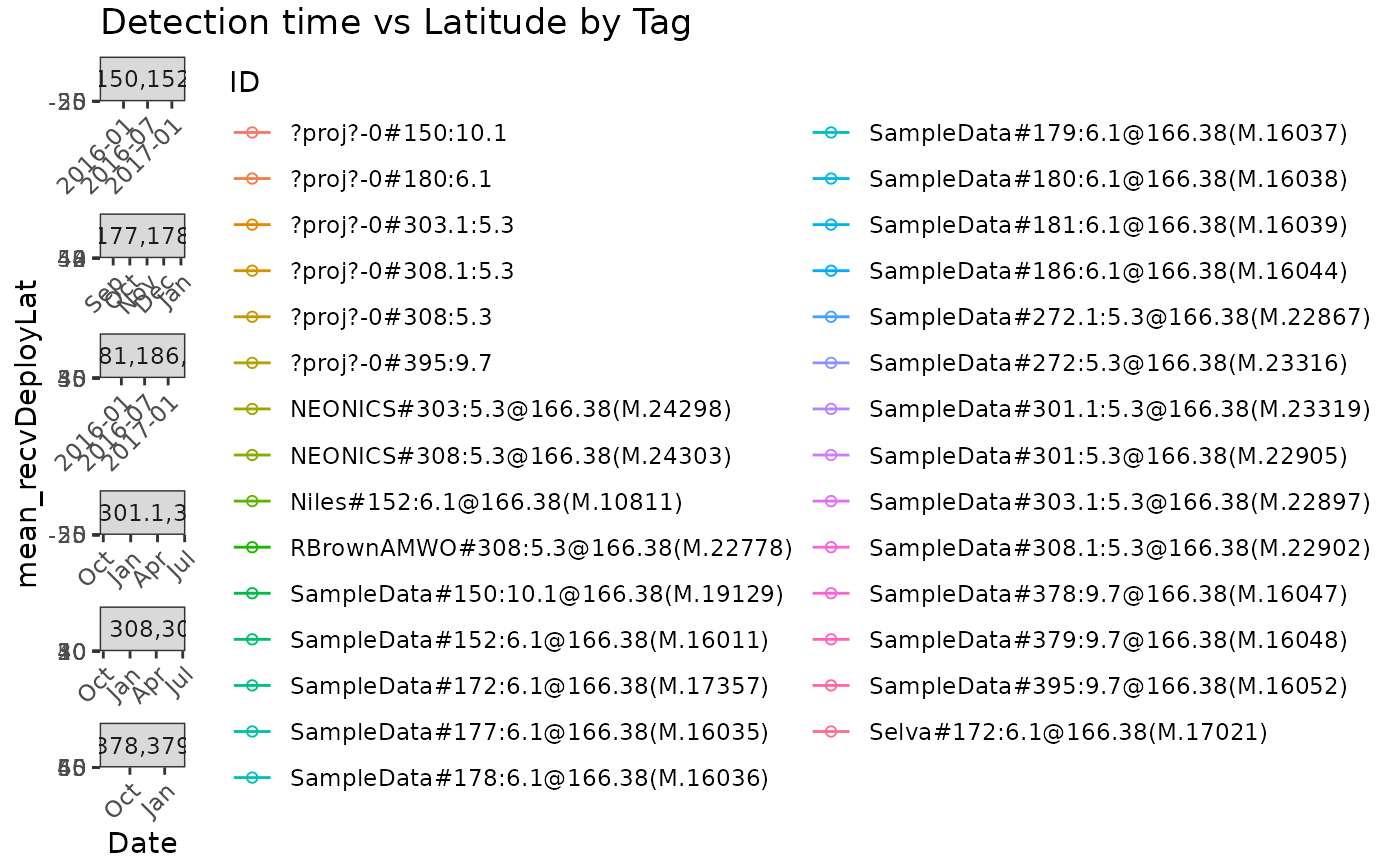
# Plot tbl file tbl_alltags with default GPS latitude data and 5 tags per panel
plotAllTagsCoord(tbl_alltags)
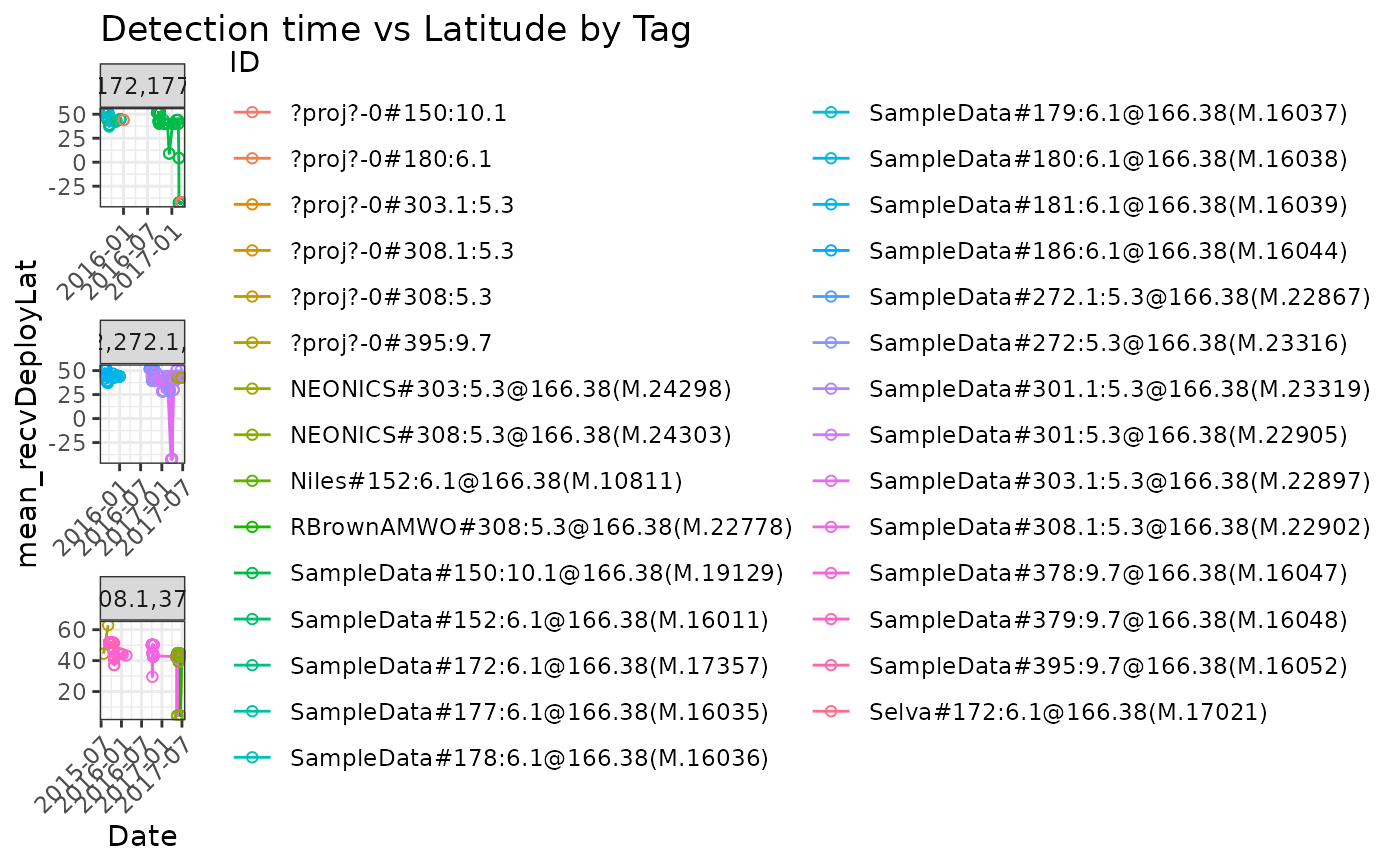
 # Plot an sql file tbl_alltags with 10 tags per panel
plotAllTagsCoord(tbl_alltags, tagsPerPanel = 10)
# Plot an sql file tbl_alltags with 10 tags per panel
plotAllTagsCoord(tbl_alltags, tagsPerPanel = 10)
 # Plot dataframe df_alltags using receiver deployment latitudes with default
# 5 tags per panel
plotAllTagsCoord(df_alltags, coordinate = "recvDeployLat")
# Plot dataframe df_alltags using receiver deployment latitudes with default
# 5 tags per panel
plotAllTagsCoord(df_alltags, coordinate = "recvDeployLat")
 # Plot dataframe df_alltags using LONGITUDES and 10 tags per panel
# But only works if non-NA "gpsLon"!
if (FALSE) plotAllTagsCoord(df_alltags, coordinate = "gpsLon", tagsPerPanel = 10) # \dontrun{}
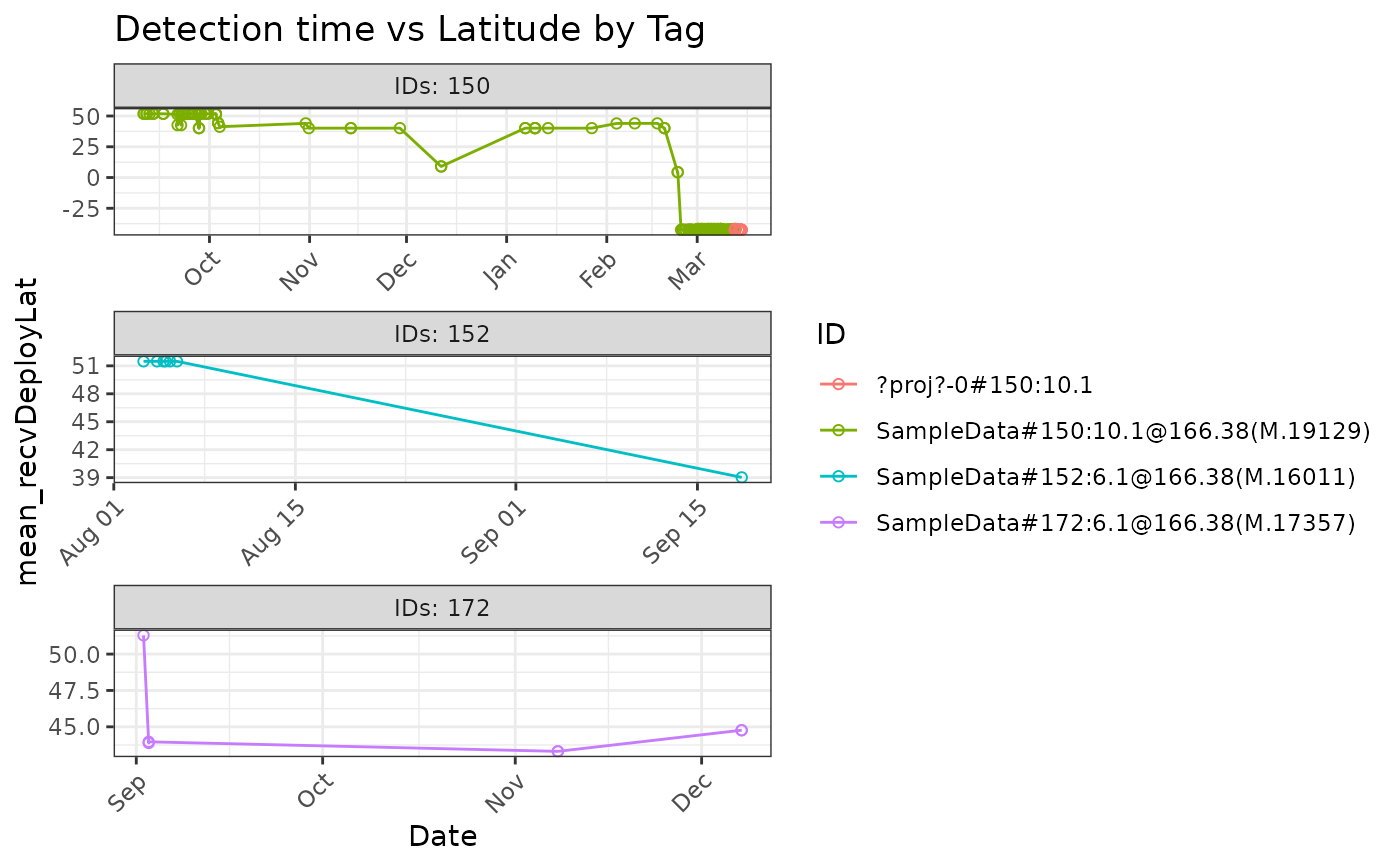
# Plot dataframe df_alltags using lat for select motus tagIDs
plotAllTagsCoord(filter(df_alltags, motusTagID %in% c(19129, 16011, 17357)),
tagsPerPanel = 1)
# Plot dataframe df_alltags using LONGITUDES and 10 tags per panel
# But only works if non-NA "gpsLon"!
if (FALSE) plotAllTagsCoord(df_alltags, coordinate = "gpsLon", tagsPerPanel = 10) # \dontrun{}
# Plot dataframe df_alltags using lat for select motus tagIDs
plotAllTagsCoord(filter(df_alltags, motusTagID %in% c(19129, 16011, 17357)),
tagsPerPanel = 1)