Plot signal strength vs time for all tags detected at a specified site, coloured by antenna
Examples
# Download sample project 176 to .motus database (username/password are "motus.sample")
if (FALSE) sql_motus <- tagme(176, new = TRUE) # \dontrun{}
# Or use example data base in memory
sql_motus <- tagmeSample()
# convert sql file "sql_motus" to a tbl called "tbl_alltags"
library(dplyr)
tbl_alltags <- tbl(sql_motus, "alltags")
# convert the tbl "tbl_alltags" to a data.frame called "df_alltags"
df_alltags <- tbl_alltags %>%
collect() %>%
as.data.frame()
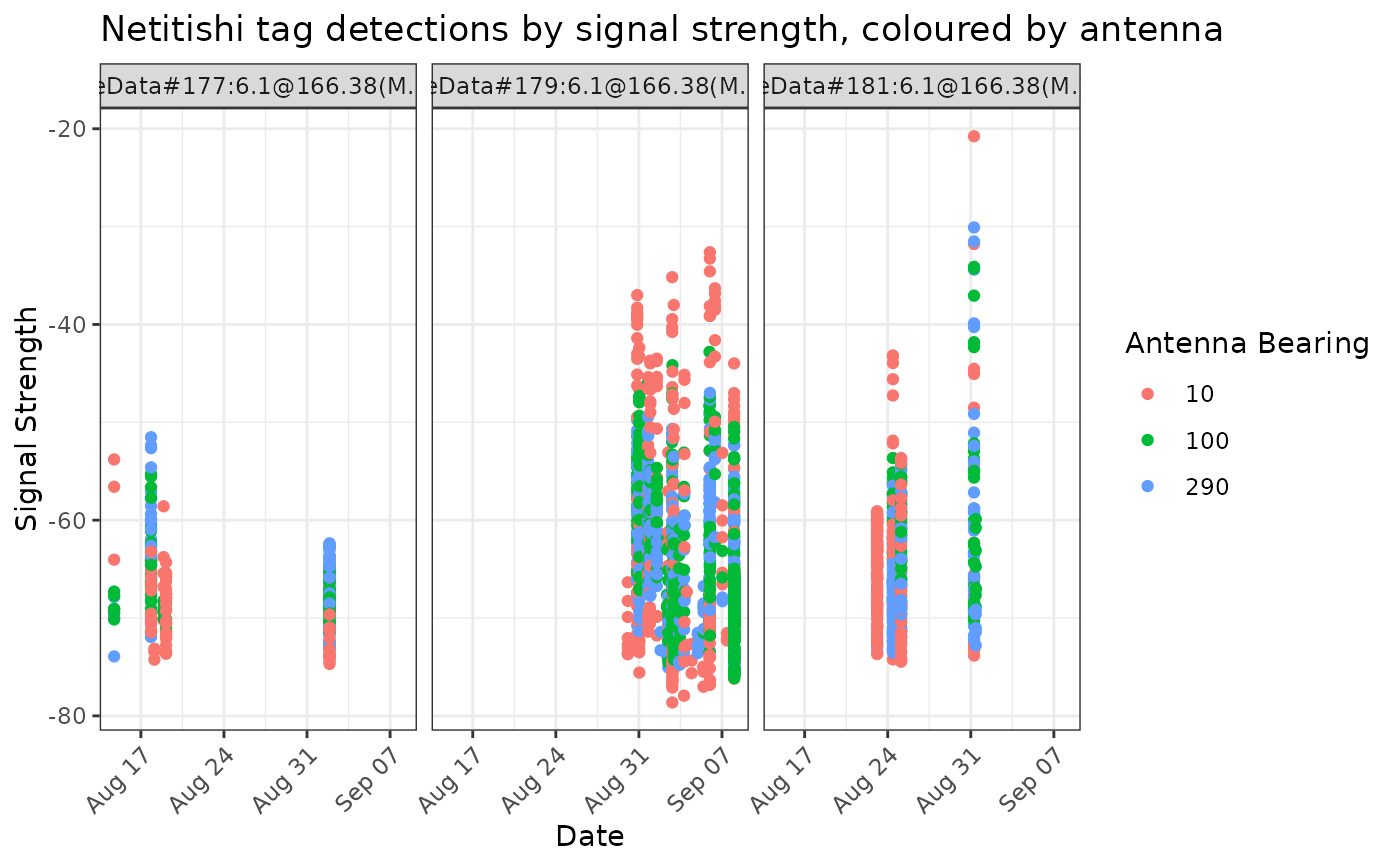
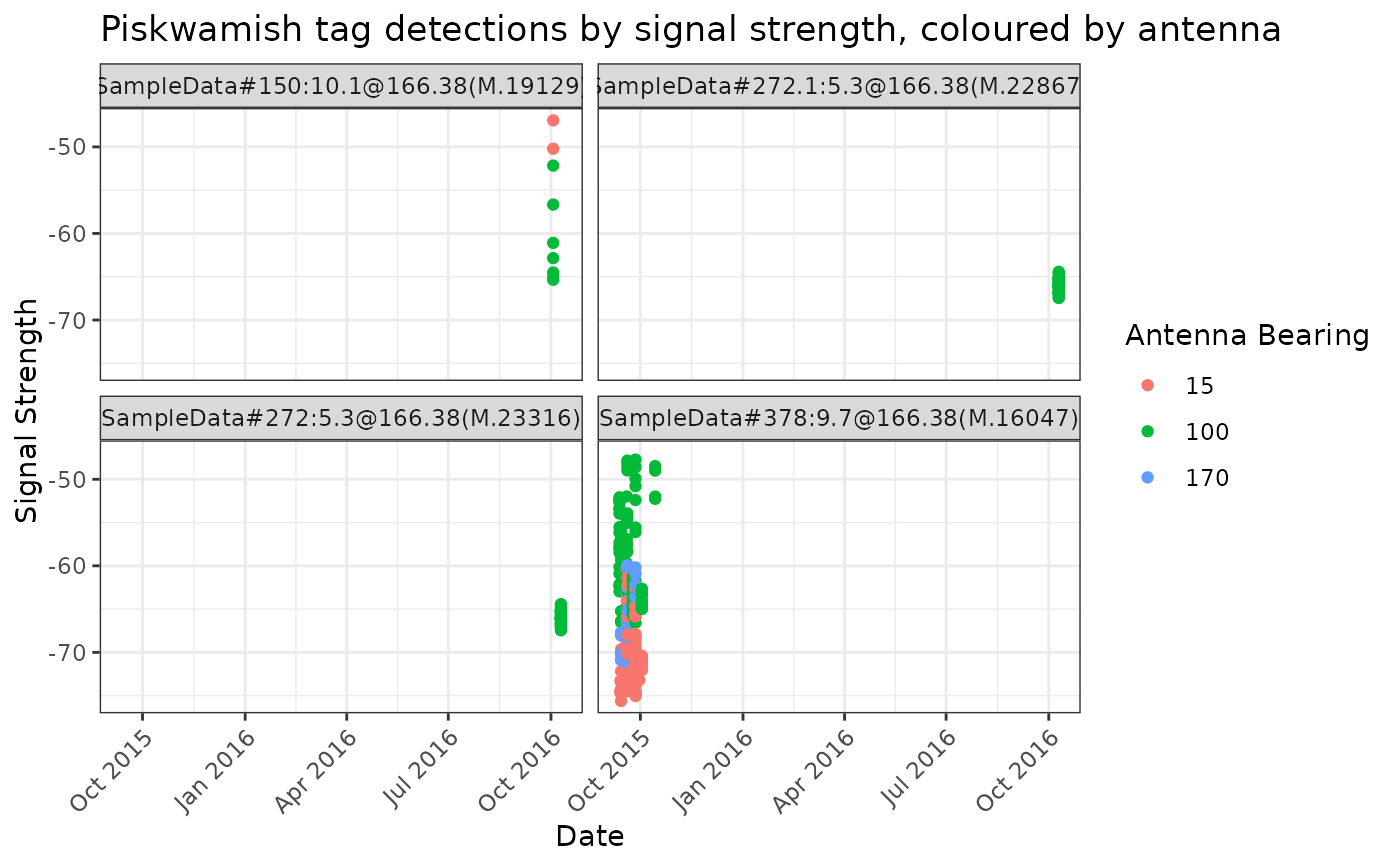
# Plot all tags for site Piskwamish
plotSiteSig(tbl_alltags, recvDeployName = "Piskwamish")
 # Plot select tags for site Piskwamish
plotSiteSig(filter(df_alltags, motusTagID %in% c(16037, 16039, 16035)),
recvDeployName = "Netitishi")
# Plot select tags for site Piskwamish
plotSiteSig(filter(df_alltags, motusTagID %in% c(16037, 16039, 16035)),
recvDeployName = "Netitishi")