Plots number of detections and tags, daily, for a specified site
Source:R/plotDailySiteSum.R
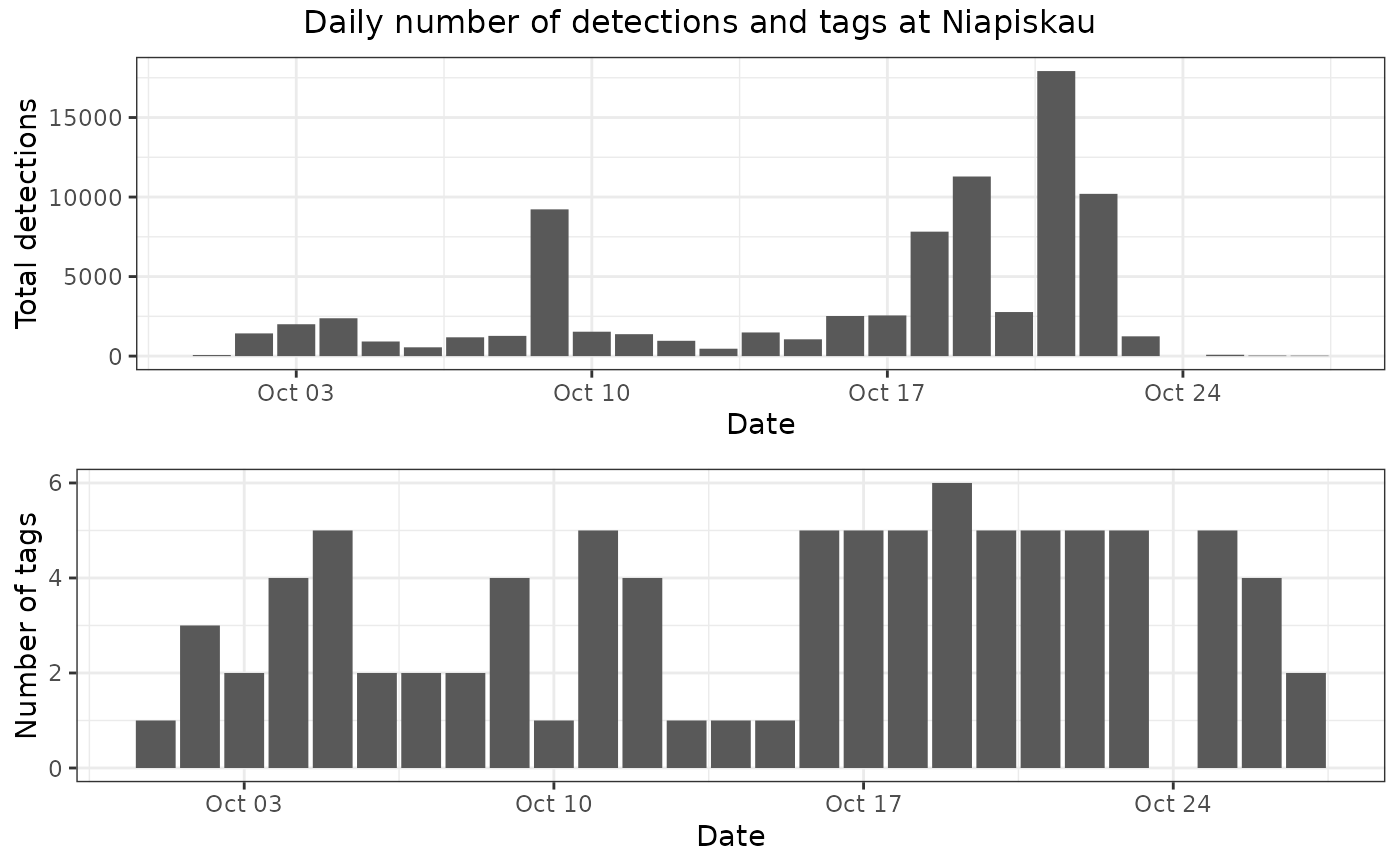
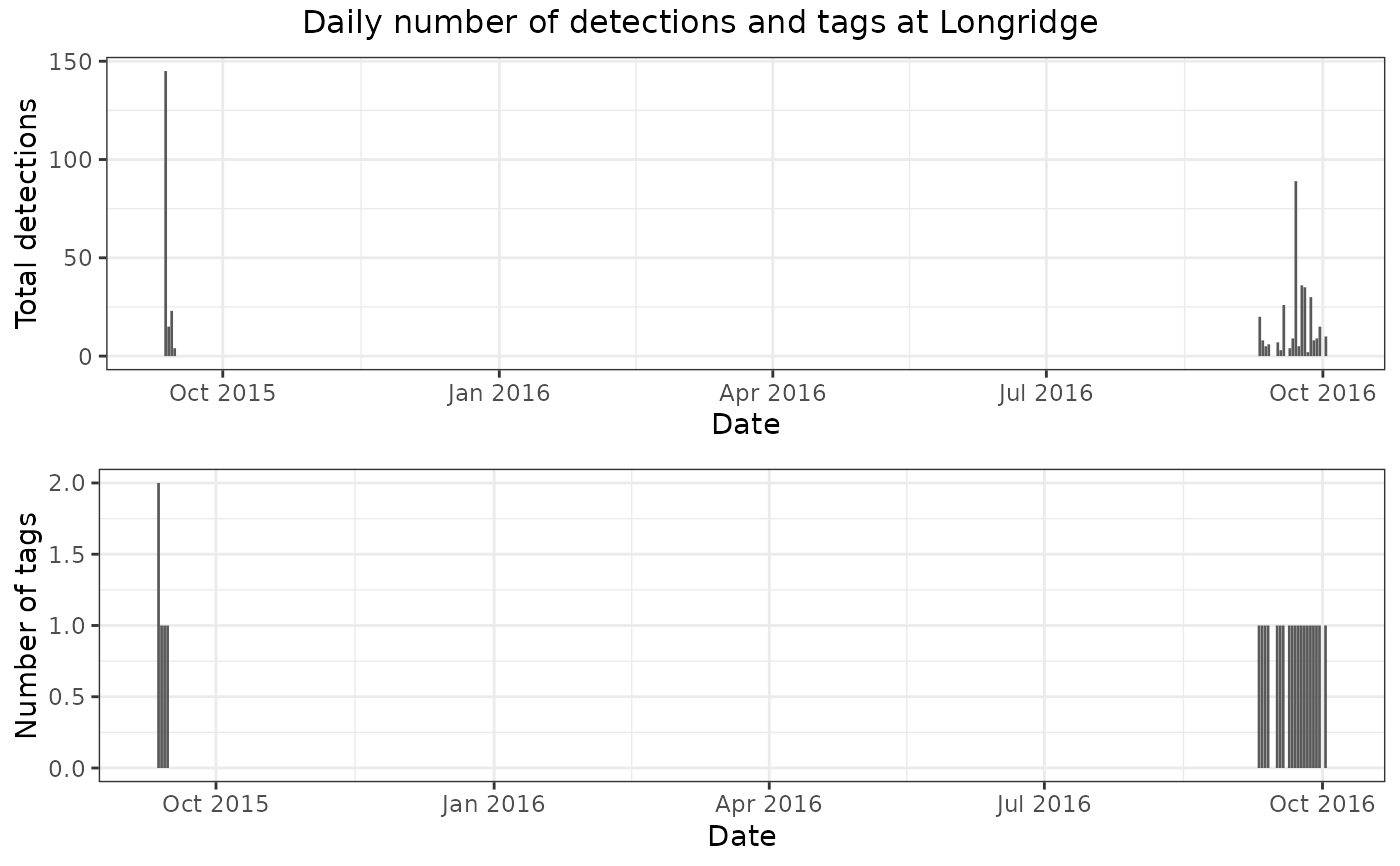
plotDailySiteSum.RdPlots total number of detections across all tags, and total number of tags
detected per day for a specified site. Depends on siteSumDaily().
Examples
# Download sample project 176 to .motus database (username/password are "motus.sample")
if (FALSE) sql_motus <- tagme(176, new = TRUE) # \dontrun{}

# Or use example data base in memory
sql_motus <- tagmeSample()

# convert sql file "sql_motus" to a tbl called "tbl_alltags"
library(dplyr)
tbl_alltags <- tbl(sql_motus, "alltagsGPS")

# convert the tbl "tbl_alltags" to a data.frame called "df_alltags"
df_alltags <- tbl_alltags %>%
  collect() %>%
  as.data.frame()

# Plot of all tag detections at site Longridge using dataframe df_alltags
plotDailySiteSum(df_alltags, recvDeployName = "Longridge")


# Plot of all tag detections at site Niapiskau using tbl file tbl_alltags
plotDailySiteSum(df_alltags, recvDeployName = "Niapiskau")
# Plot of all tag detections at site Niapiskau using tbl file tbl_alltags
plotDailySiteSum(df_alltags, recvDeployName = "Niapiskau")